TRACE Reports
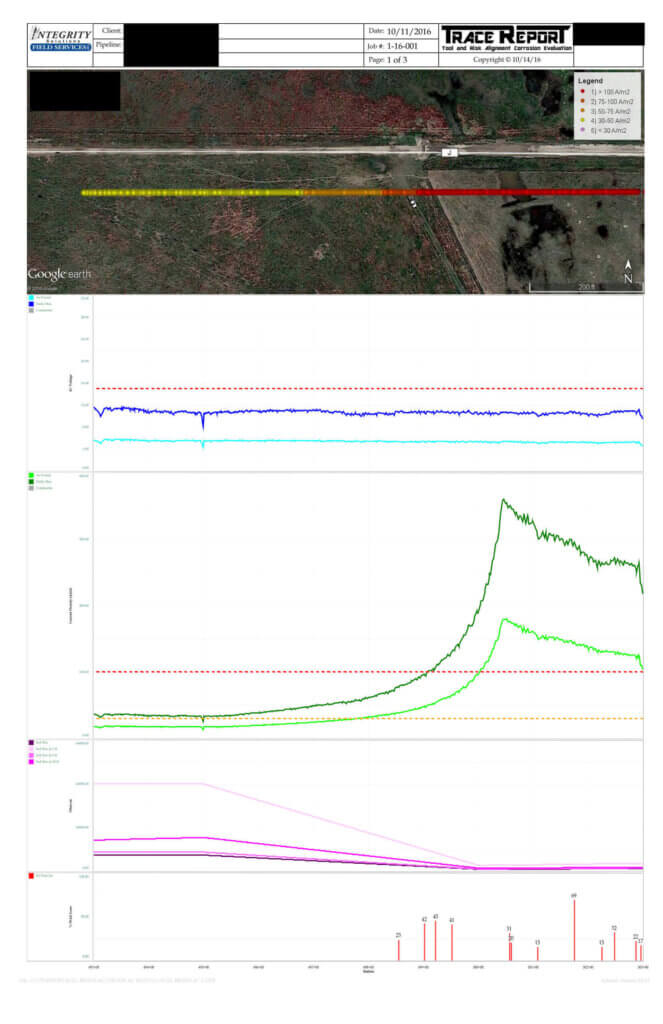
The Tool and Risk Alignment Corrosion Evaluation (TRACE) Report is the deliverable from our custom-built software. This unique reporting tool can align data from multiple tools, multiple vendors, and multiple years with aerial imagery all on one sheet.
Datasets
Want to see…
- Imported and aligned data from other vendors?
- 2010 ILI data, 2015 ILI data and this year’s CIS data all aligned?
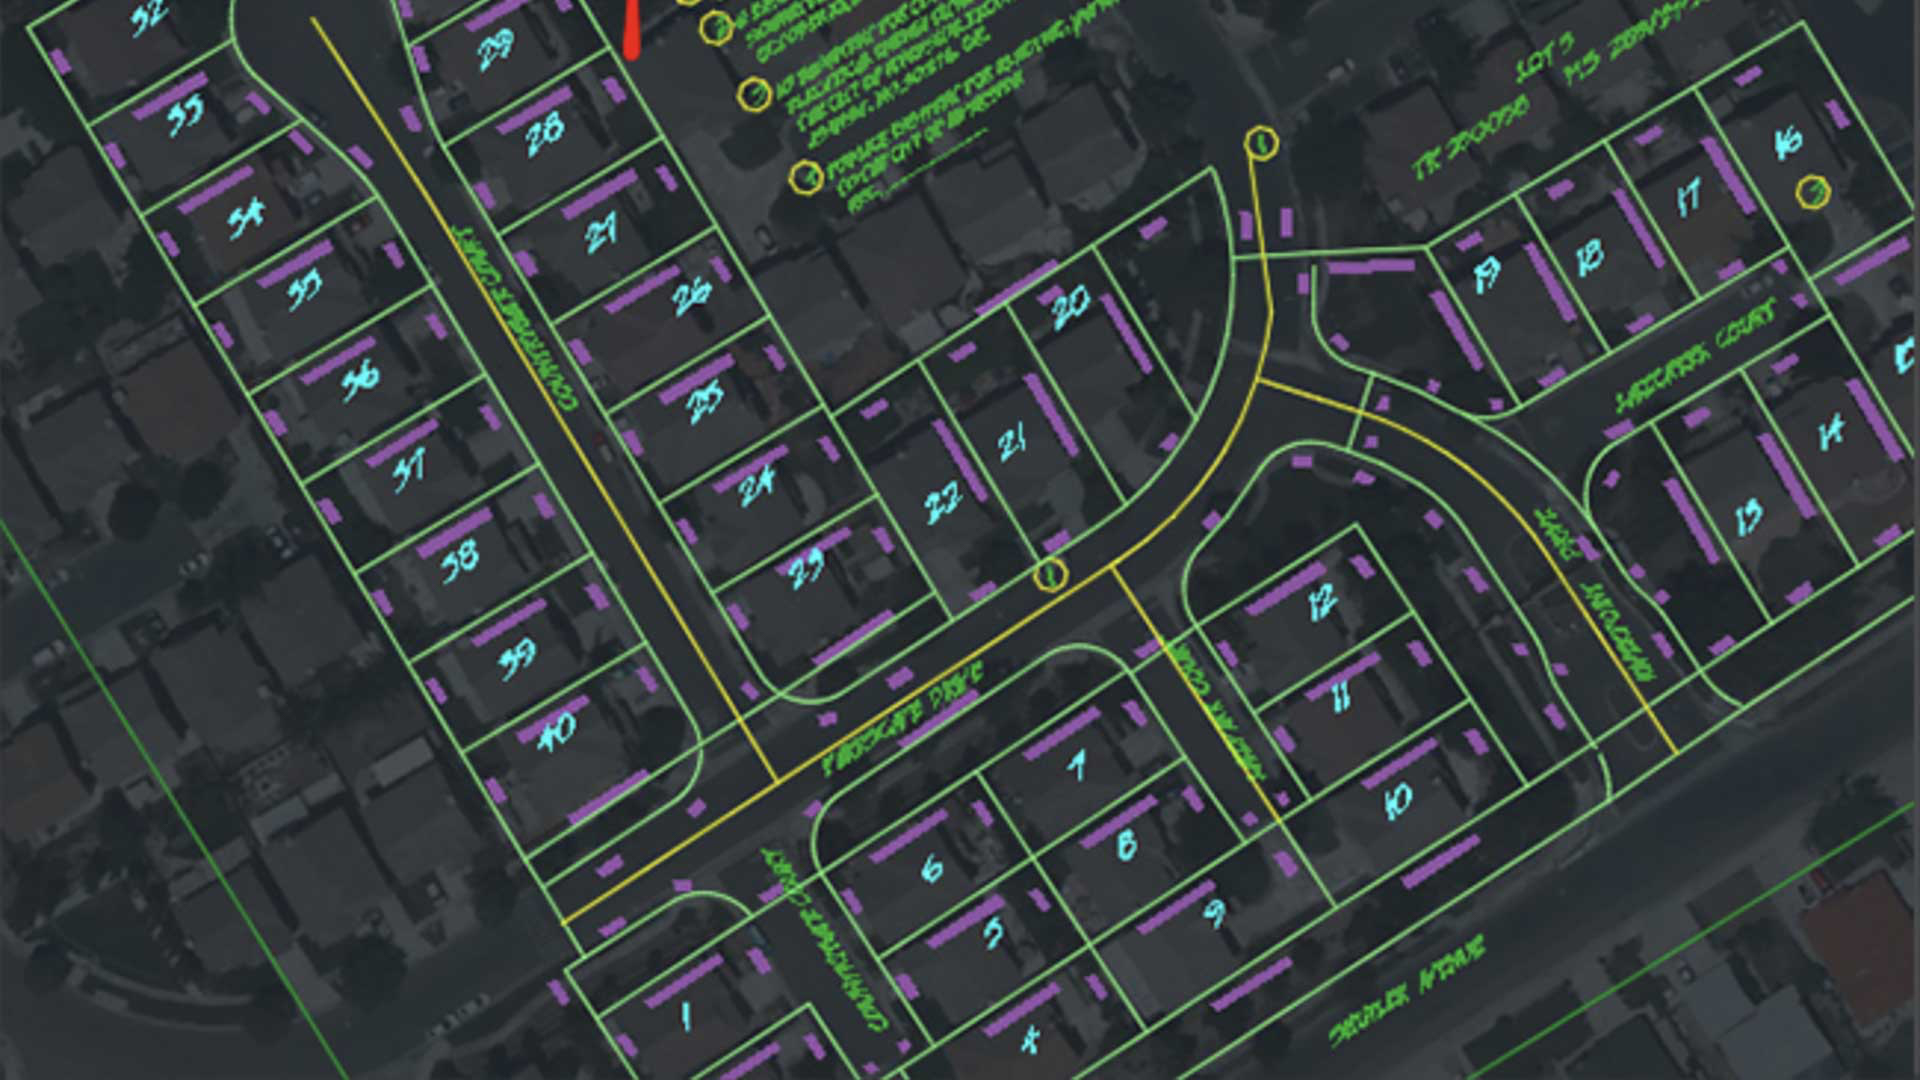
- 2007 ECDA, 2014 ECDA, and 2021 ECDA all aligned with previous dig locations so you don’t dig in the same place?
…We can do that.
Customization
Want to see…
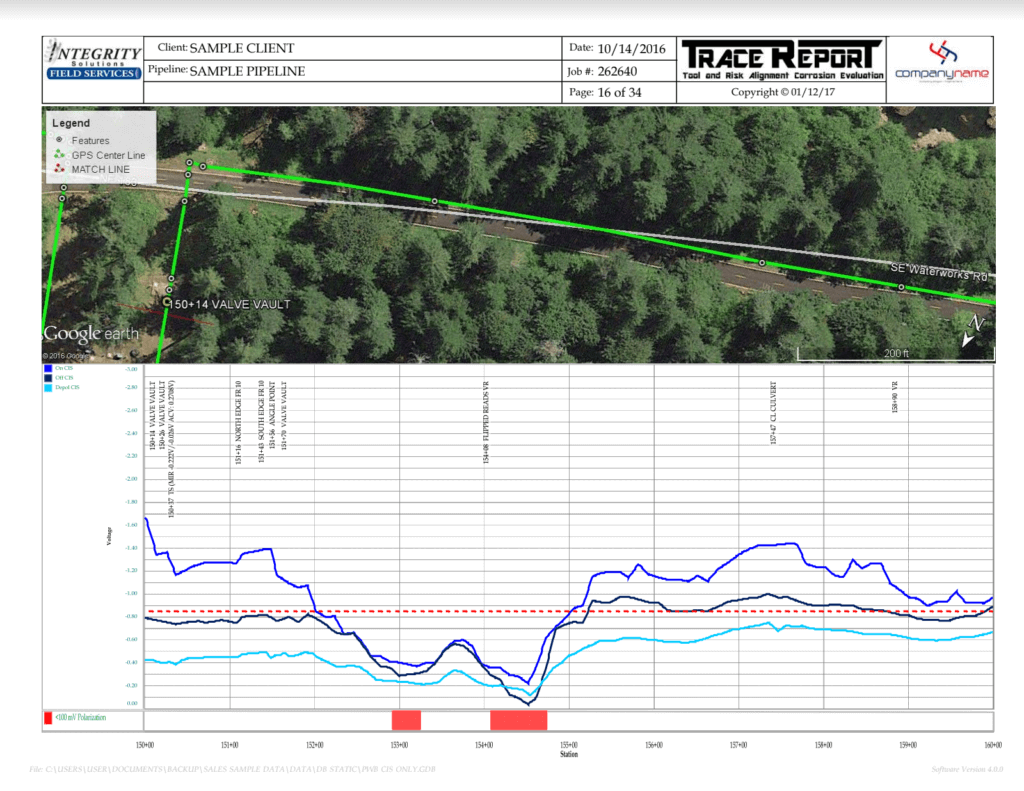
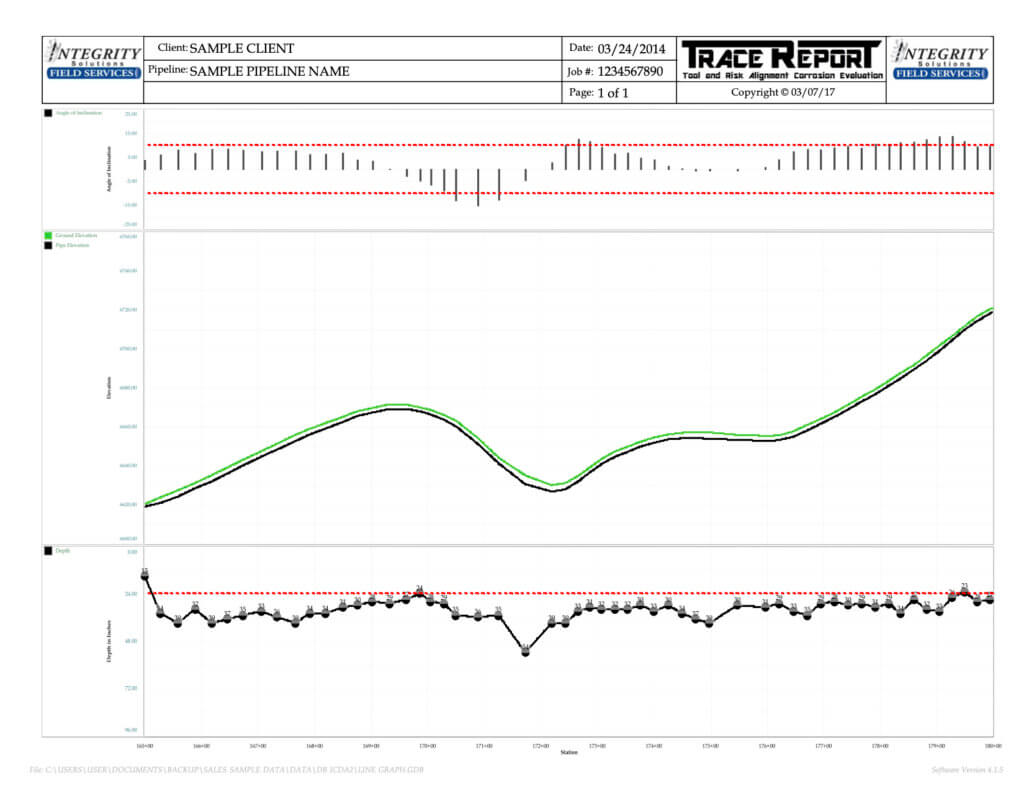
- Previous survey data on the same graph with new data?
- Previous and current data on top of each other?
- The ILI data row wider or taller?
- Your CIS lines in a different color?
- 1,000 feet, 1 mile, or 5 miles per page?
…We can do that.
Exception Reports
Want to see…
- Your standard less negative than -0.850 volts?
- Where potentials are only marginally compliant, say near -0.875 volts or -0.900 volts?
- A picture of that exposed pipe with coordinates?
- How many broken pipeline markers or test station you have and where they are?
- AC voltages and soil resistivity values correlated at every test station in your surveyed area to quickly calculate current density to see if you have a potential interference issue?
…We can do that.